Republished with permission from Governing.com, by Carl Smith
With the arrival of the 2020 Census redistricting data, voting maps have become the latest front in America’s never-ending, two-party battle for control of Congress and statehouses. Moving forward in a lingering atmosphere of suspicion and controversy around last year’s election, the 2020 cycle feels even more consequential. And time is of the essence. Due to pandemic delays, the Census Bureau didn’t release the data states need to draw maps until Aug. 12. That hit up against statutory or constitutional deadlines for redistricting in many states.
“What we’re seeing now is redistricting under a microscope,” said redistricting veteran Jeff Wice, special counsel to the New York State Assembly, in a webinar for legislators and staff from the National Conference of State Legislatures. “You’re going to see an awful lot of press on this, you’re going to see more public involvement than you’ve ever seen before.”
This heightened level of public engagement is accompanied by a new generation of powerful, no-cost technology tools developed by a nonpartisan community that includes programmers, mathematicians, data scientists, election law experts and social scientists.
These resources enable redistricting commissions and citizens to access the power of big data and mapping tools that give voters a chance to be heard and, where needed, providing high-resolution pictures of partisan gerrymandering.
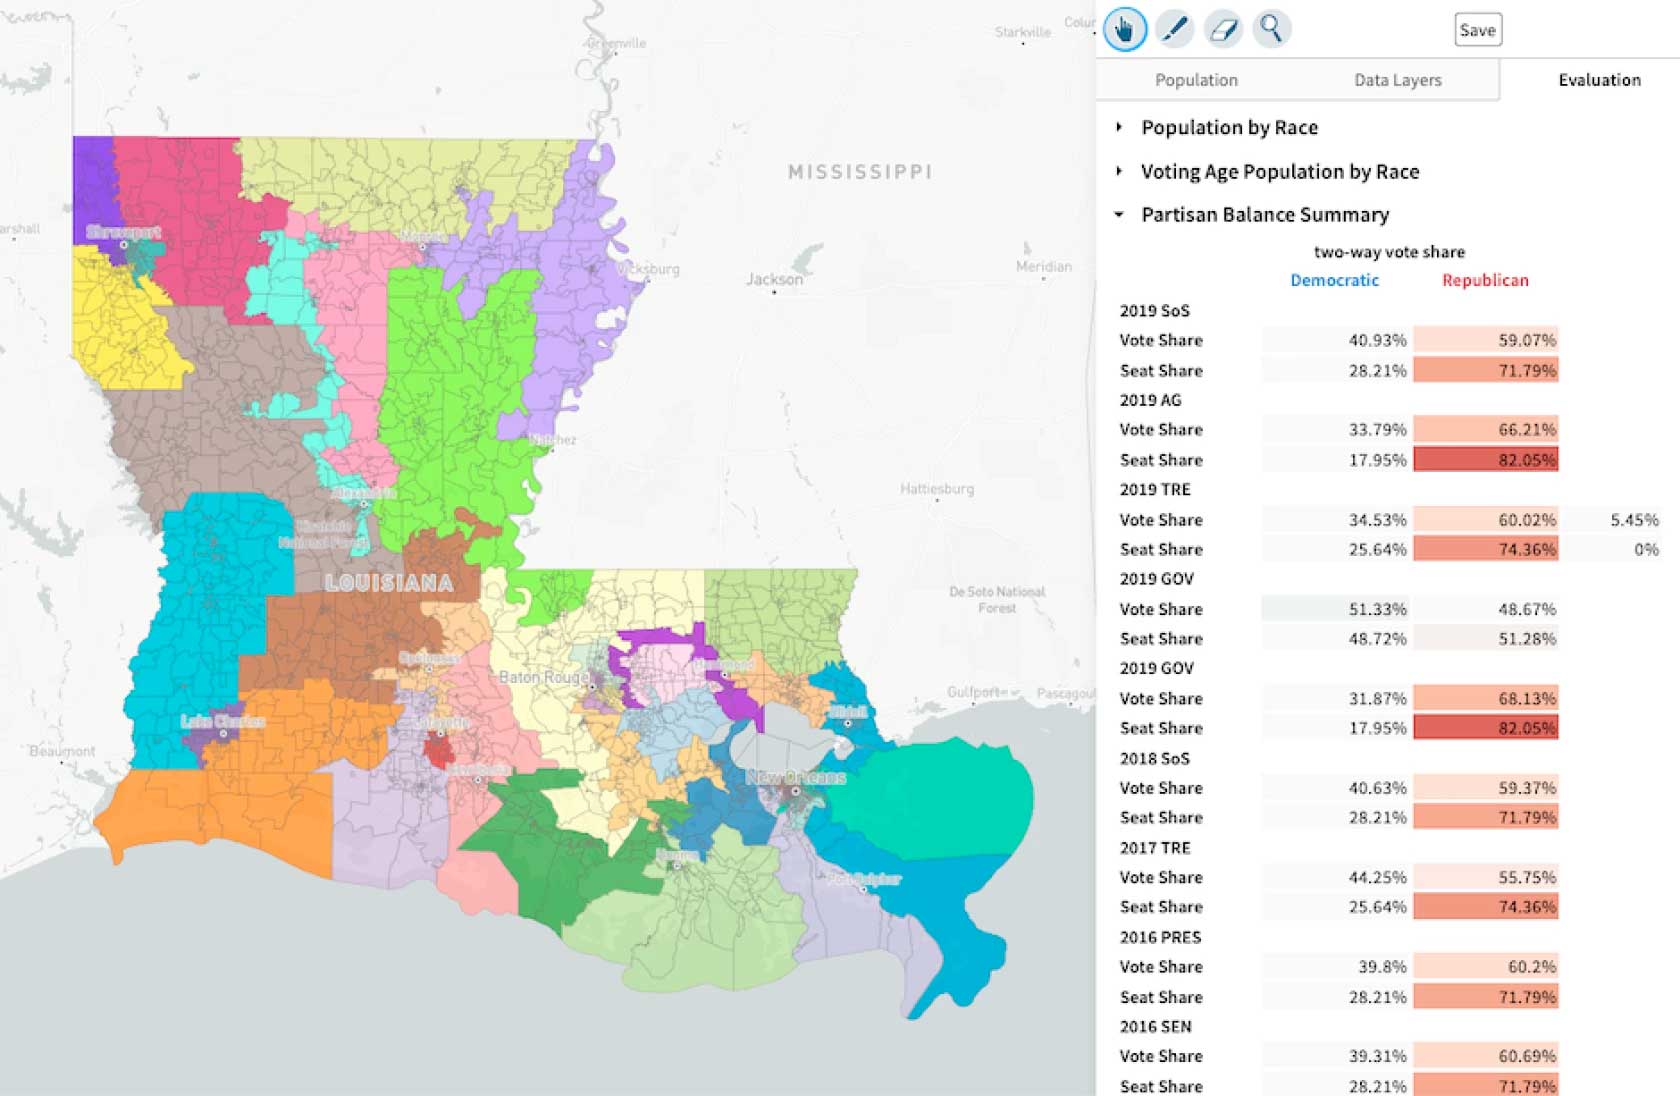
A state senate plan enacted in the previous Census cycle, as viewed in the MGGG Redistrictr interface. (MGGG)
Electoral Geometry
At Tufts University, mathematician Moon Duchin leads a team that is exploring how geometry and computing can be used to create better voting maps. “There’s been a real sea change — people have been dreaming about using computers to do redistricting since the sixties, but the dream really kicked into gear as a reality sometime in the middle of the last cycle,” she says.
At present, a big priority for the MGGG Redistricting Lab (mggg.org), which she founded at Tufts in 2016, is to support the work of independent commissions and to facilitate a more transparent approach to redistricting. Duchin emphasizes that this research-driven work is “scrupulously nonpartisan.”
“There’s been a lot of attention on litigation, and of course there will be litigation in this cycle as there always is,” she says. “But for me, there’s a very important public service to be performed in helping the decision-makers make a better decision before they get sued.”
MGGG is helping collect public feedback on redistricting in a number of states, including Michigan, Wisconsin, Ohio, Missouri, Texas, New Mexico, Alaska, Pennsylvania and Florida. Rather than stepping up to a microphone at a meeting, members of the public can use MGGG’s free web-based tool, Districtr, to draw a districting plan that they think is fair, or outline their community of interest on a map.
“We think this is huge improvement on 10 years ago, to be able to take public testimony in the form of a map,” says Duchin. For Wisconsin alone, MGGG has collected nearly 1,500 community-drawn maps. Her team will aggregate these and distill them to a “few dozen” that reflect what matters to a significant number of citizens.
In some states, maps may be the responsibility of a citizen body that has no prior experience with redistricting. MGGG is also creating examples of maps that meet state requirements to help these bodies get their bearings.
In Wisconsin, for example, the People’s Map Commission, chaired by an emergency room doctor, is tasked with drawing 99 assembly districts that meet a list of 10 criteria.
“That’s daunting,” says Duchin. “One thing we can do is use automated assistance to generate a lot of maps, study their properties, and help the commission find starting points.” (A map generated by a computer should never be adopted, she says, as it could never fully reflect human, community-centered knowledge.)
MGGG also provides evaluation services after maps have been drawn, using computer power to determine whether the criteria of state law have been met. “Ohio’s got a new commission established by the voters in 2018, and the list of rules for drawing districts spans four pages — it would take a team of mathematicians and lawyers to interpret it, and even then you wouldn’t be sure you have got it all right,” says Duchin.
Acknowledging that her team of 20 does not have infinite bandwidth, Duchin hopes MGGG can also assist legislatures and other branches of government. “We’re really interested in anybody who wants our help – there’s been a lot of alarmism and there’s a lot of pressure on these new redistricting bodies.”
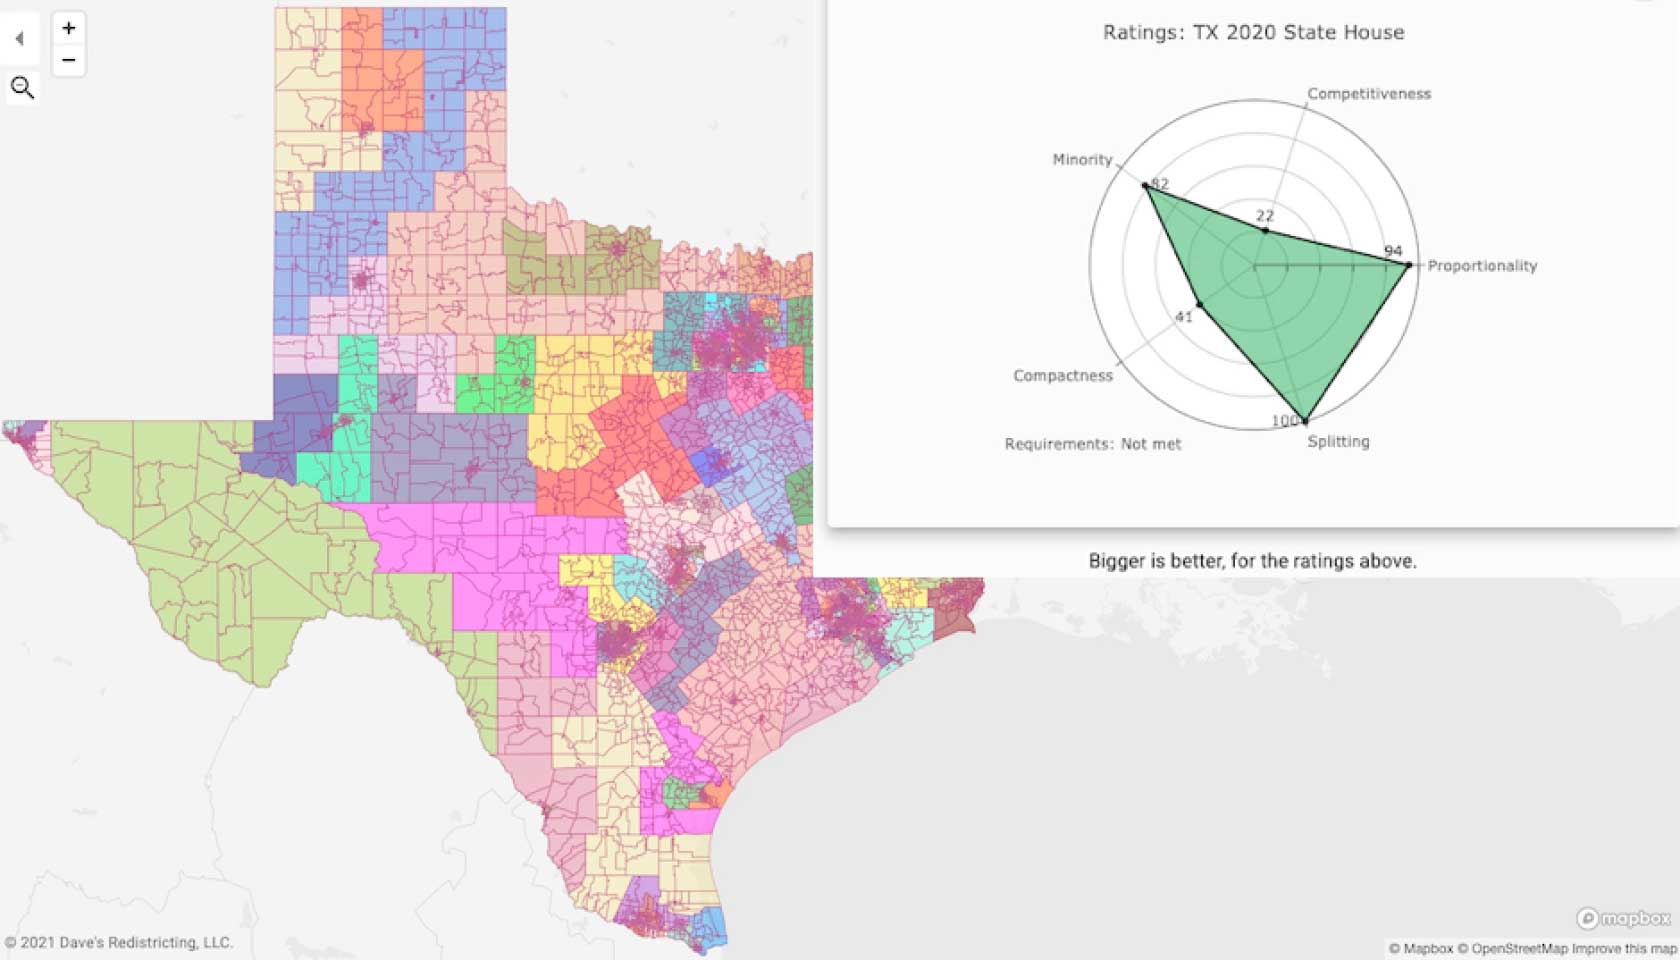
Analytics on Dave’s Redistricting website (inset) indicate that this Texas Statehouse map falls short in competitiveness and compactness. (Dave’s Redistricting)
In 2009, software engineer Dave Bradlee had left Microsoft and was taking a break before looking for his next job. He was interested in what might come out of the redistricting cycle that was on the horizon and looked for a way to use his technology skills to keep track of things.
“There wasn’t anything out there that you could use to game out what could happen with redistricting in the upcoming years without spending $10,000 on maps or something,” says Bradlee. He decided to see what he could do about this and created an app.
He began blogging about his project, and a community of people who shared his interest emerged, providing feedback on content and technology. “It got used a little bit over the decade,” says Bradlee. In 2018, Dave Wasserman of FiveThirtyEight contacted him. “We put a little more data in, and Dave used that to make the maps in the Atlas of Redistricting.”
As 2020 approached, the technology that Bradlee had used to create his original app was no longer compatible with browsers. He teamed up with other ex-Microsoft engineers to create an upgraded version of Dave’s Redistricting. “It does a lot more than the old one,” he says.
Like MGGG, Bradlee and his partners consider their tool to be nonpartisan. Their mission, he says, is fair and transparent redistricting. The app is intended to help “regular people” understand and evaluate plans in terms of factors including partisan fairness and community interests, and give input about what they’d like to see.
“You can create congressional, legislative, city, county, any kind of local districts for any state, any area within any state,” Bradlee says. “Most of the time it makes sense to be at the precinct level, but you can go down to the census block level if you need to.”
Bradlee is especially proud of the analytics that are incorporated in the new app. These include competitiveness, minority representation, compactness, proportionality, compactness and splitting, tools that can help stakeholders cast light on paradoxes that might otherwise go unnoticed.
“Sometimes a district is 60 percent Black or something,” says Bradlee. “There’s a point where having too many minorities in the same district takes away from their representation statewide – they could have 50 percent and still elect a representative of their choice and the other 10 percent could help create another district that would have an opportunity for minorities as well.”
Dave’s Redistricting has done training with community groups, Common Cause, the League of Women Voters and others so they can make the most of its features. The website includes how-to articles and videos, and staff actively monitor and respond to help requests from users.
Bradlee is encouraged by the number of people who seem serious about the redistricting process and want to get involved and advocate. The push for more engagement isn’t just coming from voters afraid they will lose their voice.
“Oklahoma did their state legislative maps back in April or May without waiting for the new data,” he says. “They contacted us and said, ‘We’re going to put on our website that people should use Dave’s Redistricting to submit maps to us’ — that was pretty cool.”
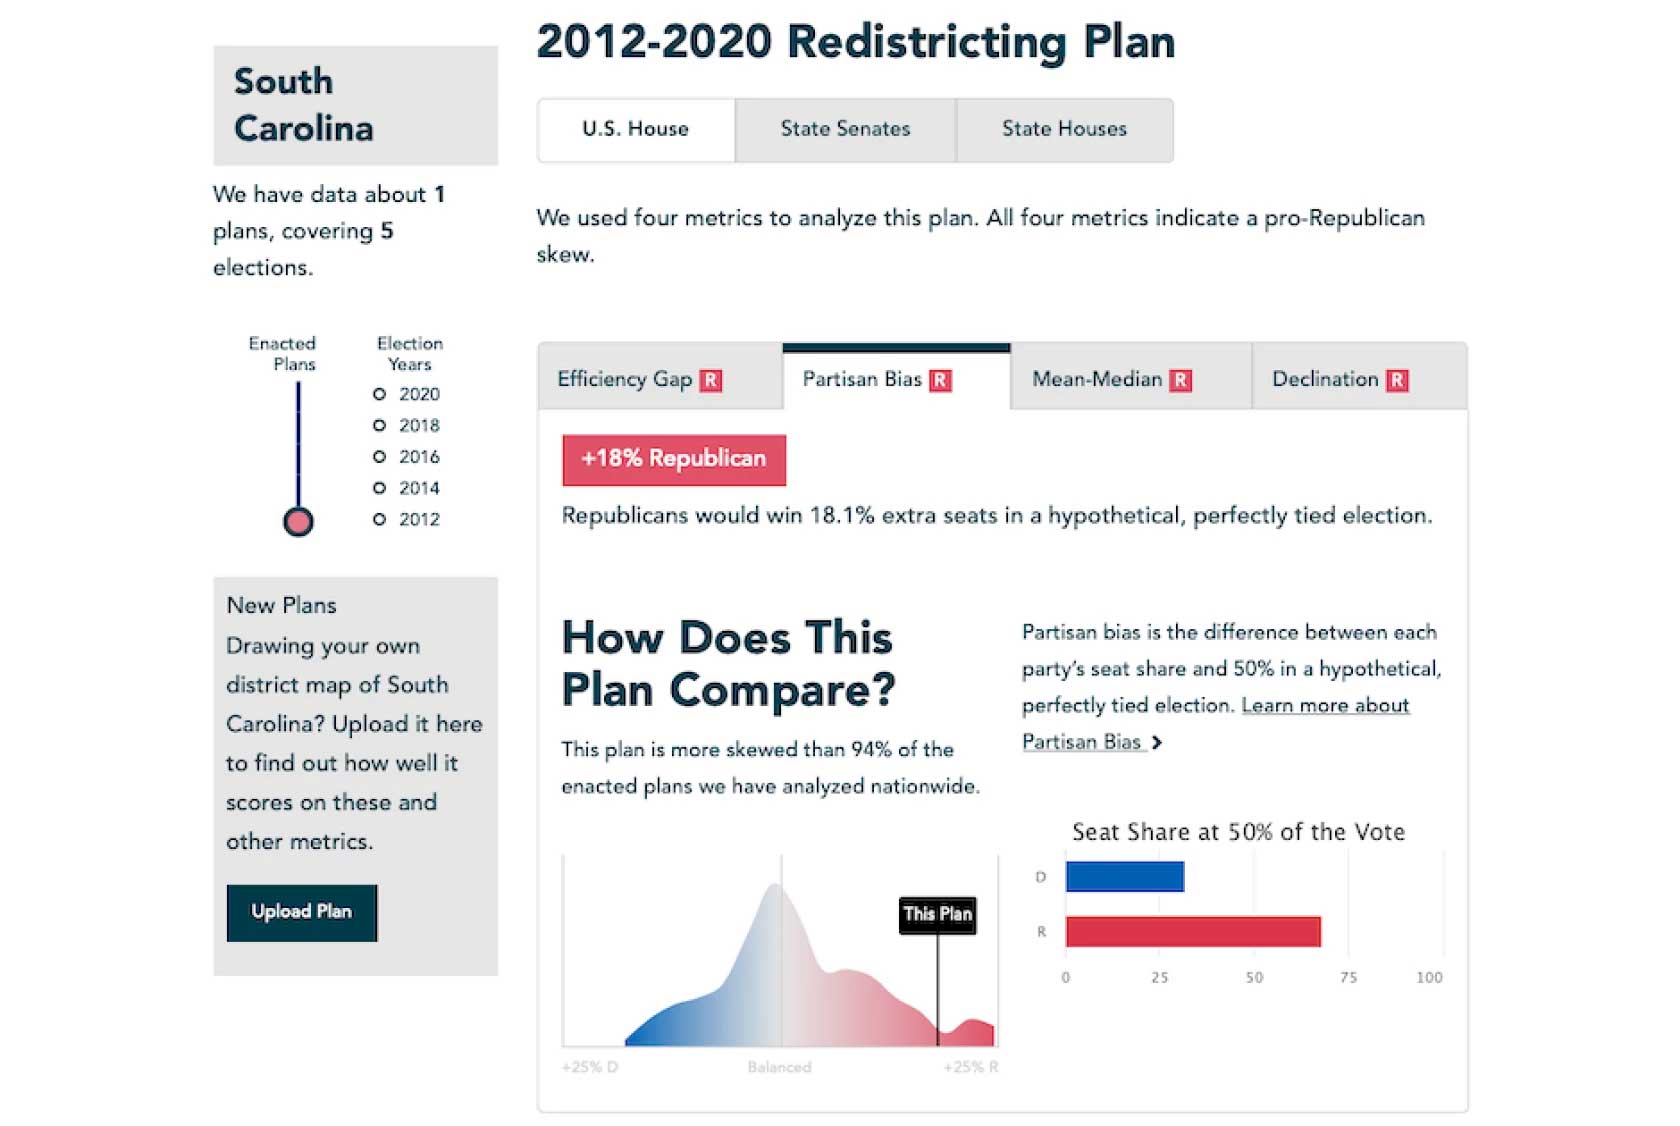
An analysis of the partisan bias of South Carolina’s current U.S. House district map using the PlanScore tool. (CLC)
Keeping Score on Gerrymandering
Attorney Ruth Greenwood shares Bradlee’s and Duchin’s belief that better and more data can improve redistricting outcomes, but she brings a different skill set to this challenge. The director of the Election Law Clinic at Harvard Law School, she is actively engaged in election law litigation, and took two partisan gerrymandering cases from trial to the Supreme Court.
Greenwood is a co-founder of PlanScore, a free online resource that measures partisan gerrymandering against four distinct measures. Users upload the data files for state maps, and PlanScore generates projections of their partisan consequences. (If a user only has a PDF of the map, the PlanScore team can generate the necessary files for them.)
Greenwood helped PlanScore come to life in cooperation with social scientists, legal scholars and software engineers. The project is now under the leadership of the nonprofit Campaign Legal Center (CLC).
“In the absence of the availability of Supreme Court intervention, when maps are really unfair, we need some way to ensure that we expose gerrymanders when they’re occurring, quickly, and that the tools to do so are available to everyone,” says Aseem Mulji, counsel to CLC. “PlanScore allows anybody, policymakers included, to score maps and evaluate them under the most widely accepted measures of partisan gerrymandering.”
“When we started, it would take 10 minutes to run a plan, which was still amazing compared to my many hours of work to analyze a plan,” says Greenwood. Since then, the software has evolved to be able to accomplish this task in under 90 seconds.
This on-demand evaluation means that the public can get insight into the likely effects of a plan and submit alternatives before it gets enacted, even when there is limited time between the release of a map and a vote to approve it. “You can draw a plan, you can amend an existing plan really quickly and post it online so that it can be considered by the legislature.”
If a plan is so far out of bounds that future legal challenges are likely, a PlanScore analysis can be put into the legislative record.
Greenwood agrees that data-driven review of maps can force a reconsideration of the things that make a map look bad. Strange-looking district boundaries don’t necessarily mean a map is flawed. “Something like the Illinois 4th Congressional District, that looked weird, was actually a really brilliant district that enfranchised the local Latino community without disenfranchising a Black community that also lived on the west side of Chicago.”
Competitiveness can also be a counter-intuitive metric. If every district is nearly even on a partisan basis, a swing to one side could mean that none are competitive. Efficiency gap, one of the metrics in a PlanScore analysis, is a way to see if both sides have the chance to convert votes to seat. An efficiency gap close to zero, Greenwood says, shows the median legislator is aligned to the median voter.
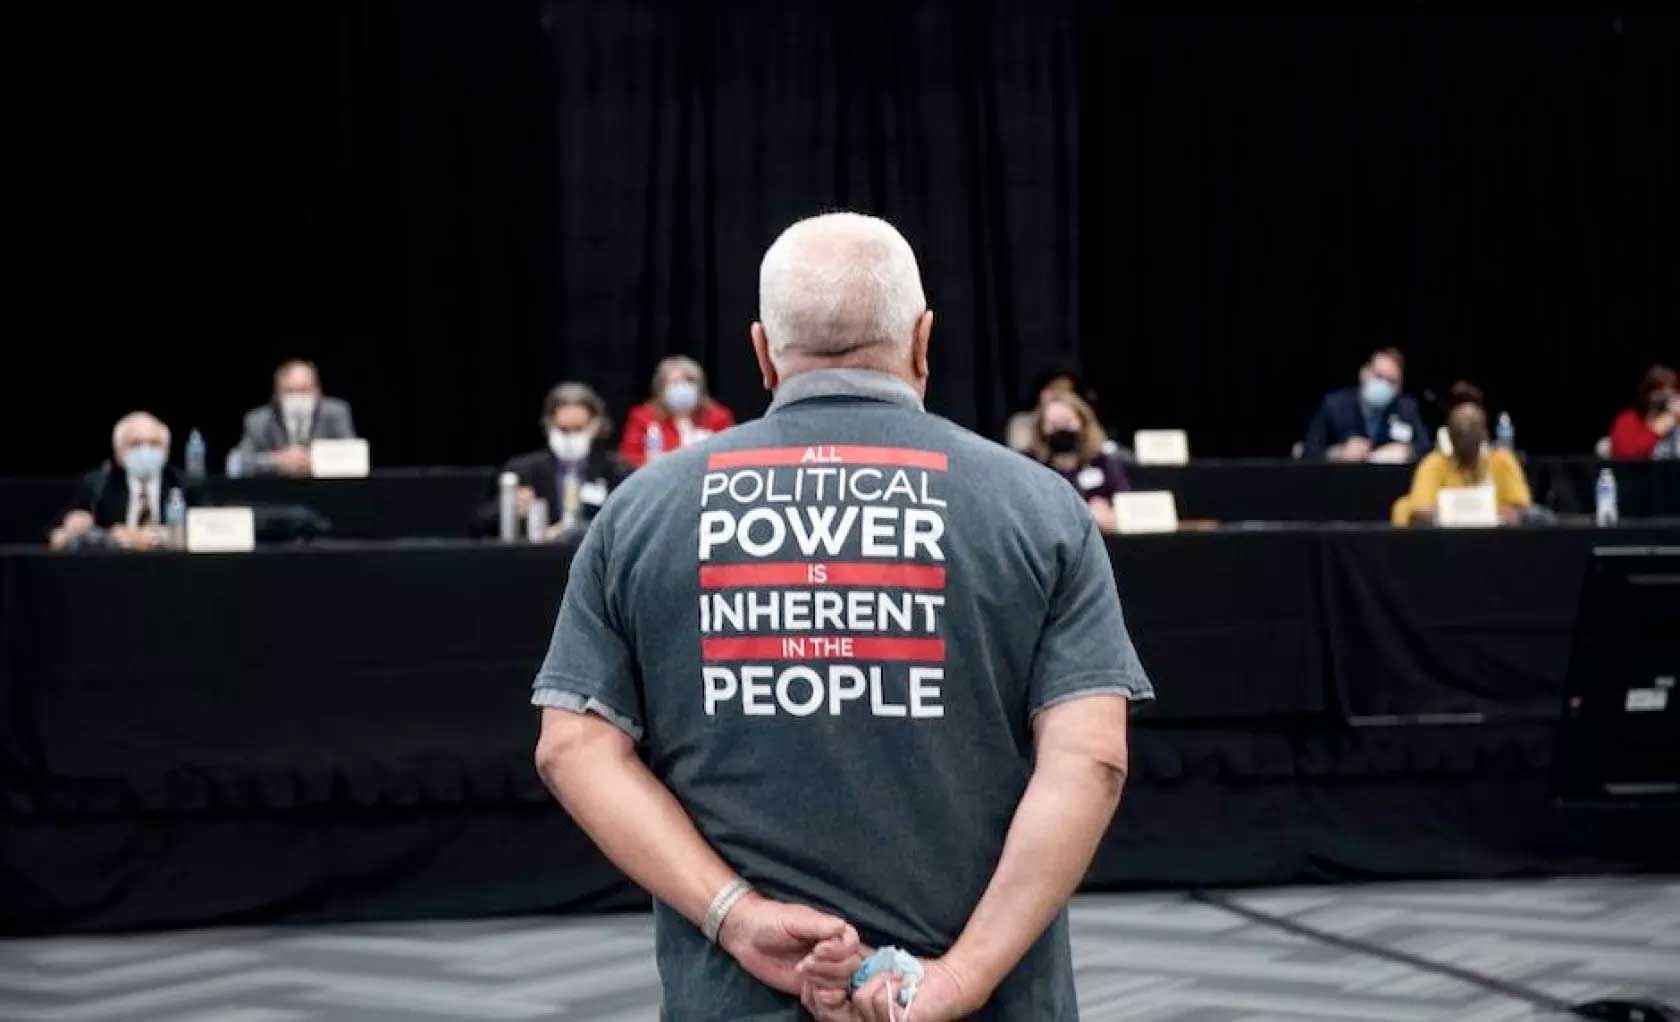
A voter speaks during public comment at a redistricting commission public hearing in Michigan(Nicole Hester/ MLive.com/TNS)
Helping Democracy Succeed
The push to bring redistricting out of the shadows is long overdue, says Greenwood. “For too long, the people in power with nefarious intent have hidden behind closed doors. It’s not just that they haven’t tried to listen to the public — they haven’t allowed the public to even understand what they’re doing before they run it through a legislative session, approve it and enact it. Then nobody can do anything about it.”
Most states are accepting public input regarding their redistricting efforts, says Dave Bradlee, a change from 10 or 20 years ago. “I think they know that there are a lot more people paying attention and getting a sense of what’s going on.”
“How much that will change the bad actors is hard to tell,” he says.
“People have always been involved in this process, mostly complaining about the lack of transparency and the fact they’re not told anything,” says Greenwood. “This time, I hope they are able to complain about the actual maps that are being drawn and maybe change whether they get passed and adopted.”
“More than what my particular politics are, I really want democracy to succeed,” says Bradlee. “That means that people actually have a voice, and this is something that gives them that voice.”
Carl Smith is a senior staff writer for Governing and covers a broad range of issues affecting states and localities. He can be reached at carl.smith@governing.com or on Twitter at @governingwriter.

Governing
Governing: The Future of States and Localities takes on the question of what state and local government looks like in a world of rapidly advancing technology. Governing is a resource for elected and appointed officials and other public leaders who are looking for smart insights and a forum to better understand and manage through this era of change.